Note
Go to the end to download the full example code.
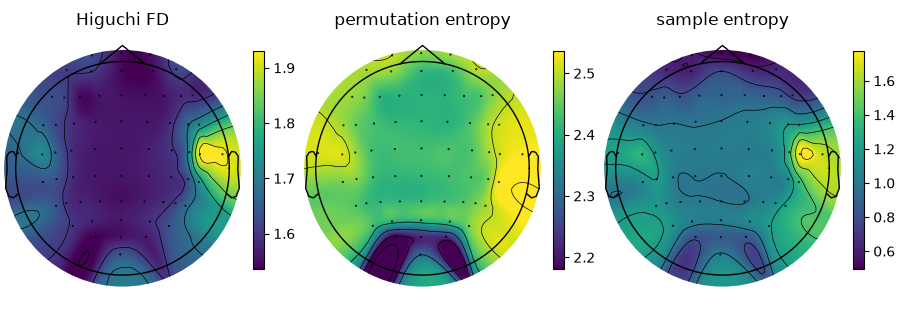
Complexity of every channel of a real EEG
One minute of resting EEG, eyes open, from subject 1 of the PhysioNet EEG Motor Movement/Imagery Dataset (64 channels, 160 Hz; Schalk et al. 2004, ODC-By 1.0). MNE downloads and caches it on first run.
import matplotlib.pyplot as plt
import mne
import numpy

import complexeva

(path,) = mne.datasets.eegbci.load_data(1, [1], update_path=False)
raw = mne.io.read_raw_edf(path, preload=True, verbose=False)
mne.datasets.eegbci.standardize(raw)
raw.set_montage("colin27_1005")
eeg = raw.get_data()  # (channels, time): time on the last axis
print(eeg.shape)
Using default location ~/mne_data for EEGBCI...
Downloading EEGBCI data
Downloading file 'S001/S001R01.edf' from 'https://physionet.org/files/eegmmidb/1.0.0/S001/S001R01.edf' to '/home/runner/mne_data/MNE-eegbci-data/files/eegmmidb/1.0.0'.
Download complete in 00s (1.2 MB)
(64, 9760)
Pass all 64 channels at once and get one value per channel.
values = {
    "Higuchi FD": complexeva.hfd(eeg),
    "permutation entropy": complexeva.permutation_entropy(eeg),
    "sample entropy": complexeva.sample_entropy(eeg),
}

fig, axes = plt.subplots(1, 3, figsize=(9, 3.2), layout="constrained")
for ax, (name, value) in zip(axes, values.items()):
    image, _ = mne.viz.plot_topomap(
        value, raw.info, axes=ax, cmap="viridis", vlim=(numpy.min(value), numpy.max(value)), show=False
    )
    fig.colorbar(image, ax=ax, shrink=0.7)
    ax.set_title(name)
plt.show()
Total running time of the script: (0 minutes 12.803 seconds)